Adding Historical Base Map in QGIS
GIS Tutorial
Background
If you just started with QGIS, a free and open geographic information system application for working with georeferenced data, you might realize there is only an empty window when you start a new project. Adding a base map is very helpful for you to comprehend and navigate your data. Basemap serves as a reference map on which you overlay data from layers and visualize geographic information. Just as a Google Map, you can zoom in and out for different levels of details in your map. However, the typical open base map such as Open Street Map might not be enough for historical research. In this tutorial, you will learn how to add Chinese historical base maps into your QGIS. Here we will demonstrate with QGIS version 3.16.0-Hannover.
Basic Setup
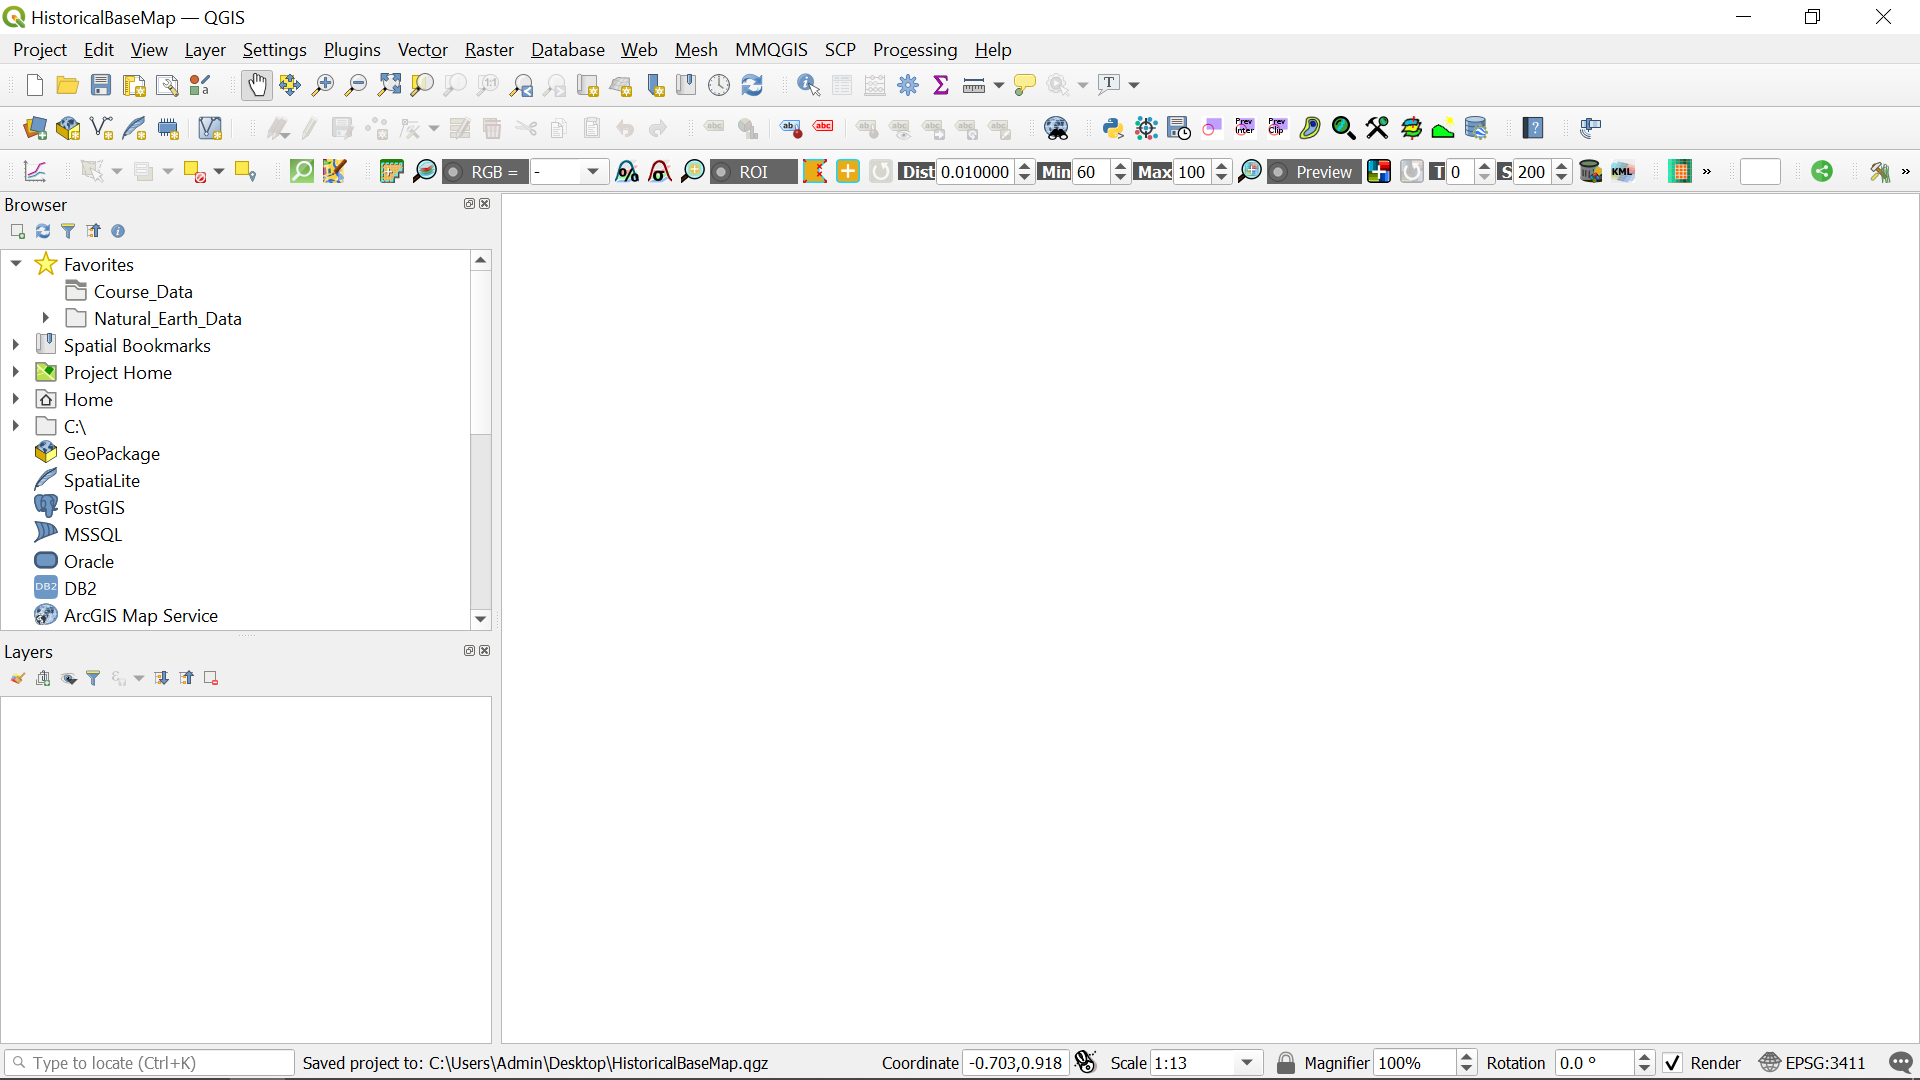
The first thing you need to do is to open a new project in QGIS. On the left side, you will see a browser panel where you can browse to a directory on your system where you have some GIS data, as well as a layer panel where the opened data will be displayed. The layer panel should be empty by now but our base map will appear there as soon as we add it.

Add the Basemaps
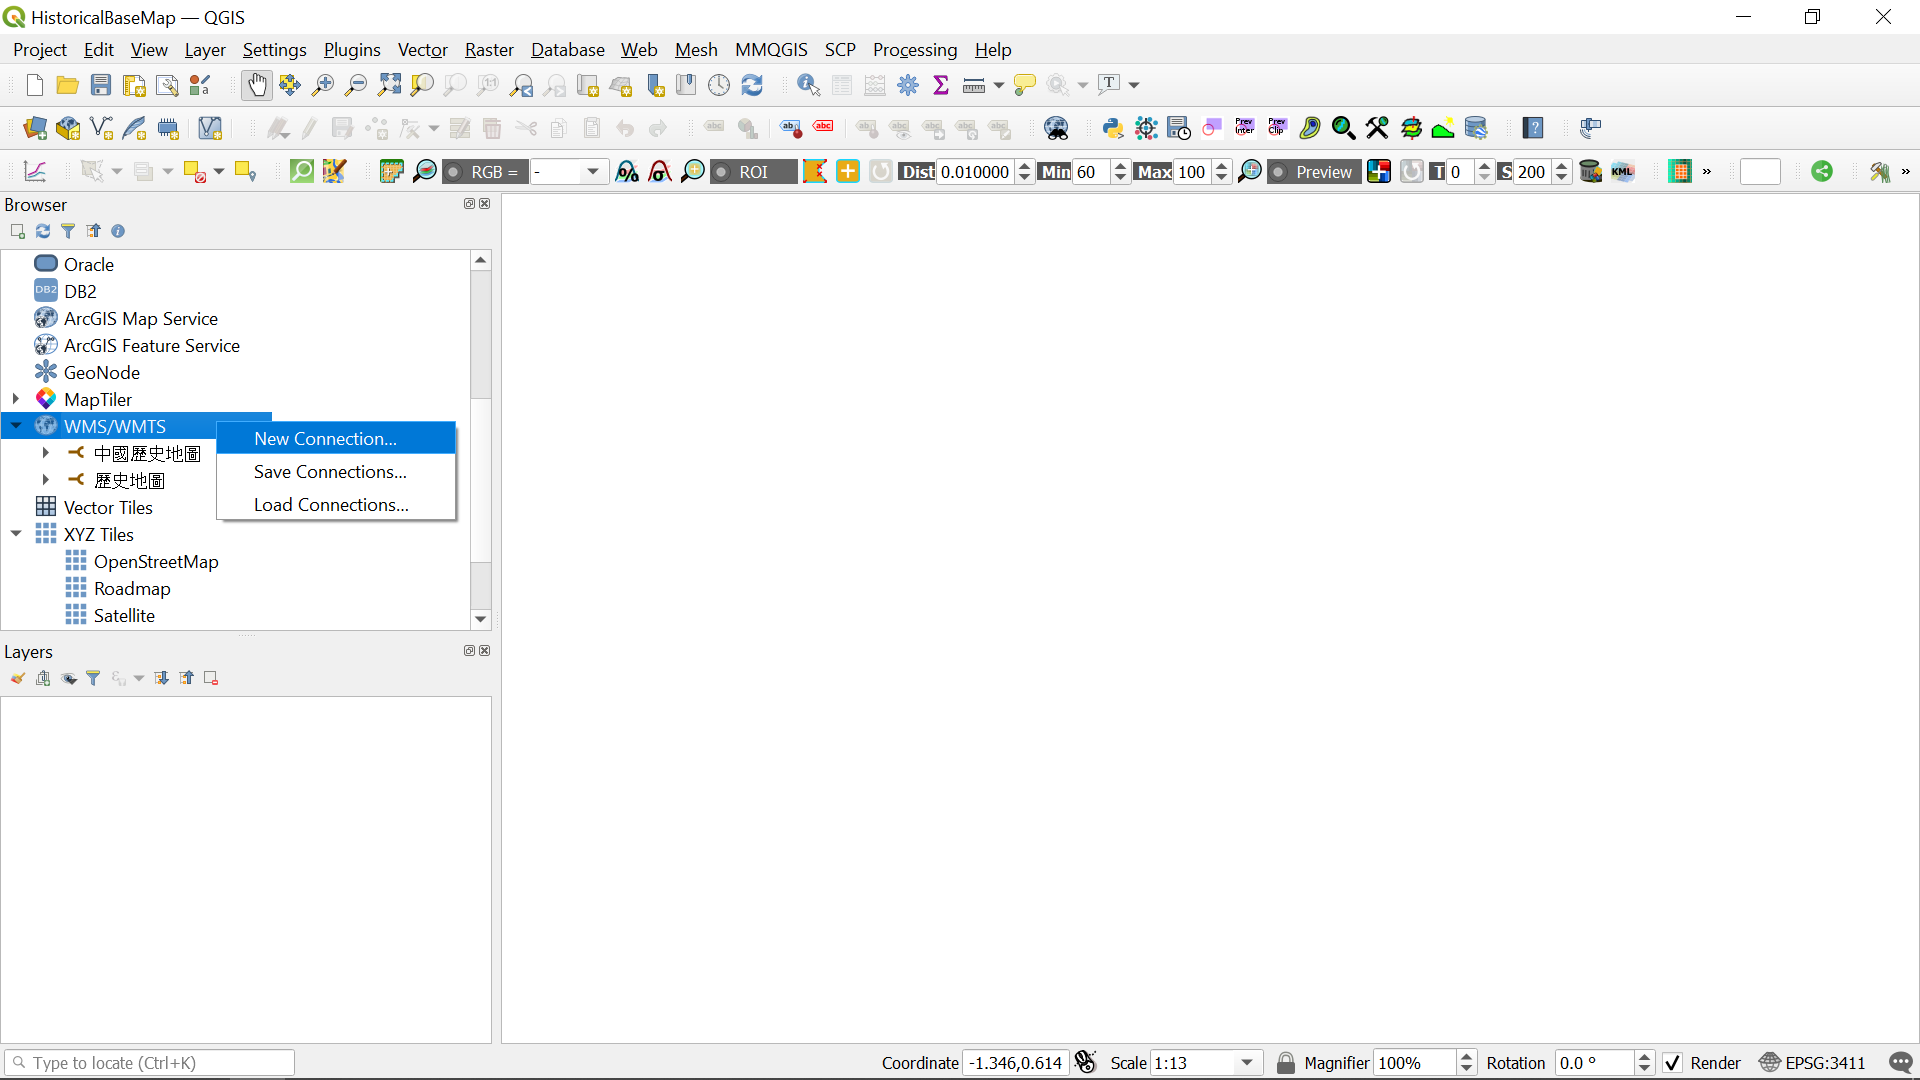
Adding a historical base map is rather straightforward. It is done via WMS/WMTS (Web Map Service), which is a service hosted on a remote server. Similar to a website, you can access it as long as you have a connection to the server. Using QGIS, you can load a WMS directly into your existing map. The WMS service can be assessed either by right-clicking the WMS/WMTS icon in the browser panel, or clicking layer from the menu bar, browsing to Add Layer and Add WMS/WMTS Layer. Then you can create a new connection by inputting the Name and URL.
Here, we will use the base maps provided by Chinese Civilization in Time and Space (中華文明之時空基礎架構) from Academia Sinica (中央研究院) in Taiwan. For the details of the project, you can visit this page.
In the screenshot below, I use the name 中國歷史地圖. For the URL, input the following:
http://gis.sinica.edu.tw/ccts/wmts?SERVICE=WMTS&REQUEST=GetTile&VERSION=1.0.0&LAYER=%7BLayer_ID%7D&STYLE=_null&TILEMATRIXSET=GoogleMapsCompatible&TILEMATRIX=%7Bz%7D&TILEROW=%7By%7D&TILECOL=%7Bx%7D&FORMAT=image/jpeg
Then click ok.


Check the Projection
For all layers correctly displayed, we need to make sure the project projection is consistent with the layer projection. As the base map layer has a projection of EPSG: 3857, we need to change the project projection to the same setting too. We can do that by clicking on the EPSG code in the bottom right of the window, where an earth icon is displayed. Then we will search for EPSG code 3857 and click apply then ok.

Then we can browse through different base maps. This is the full list of the available maps.
A shortened list:
-
唐代各道、州界 : Tang_Admin
-
唐代交通路線圖 : Tang_TrafficRoute
-
西周時期地圖 : Xijhou
-
河西新疆五十萬分一地圖集 : Xinjiang_500K_1943
-
東漢歷史地圖(E. Han) : ad0140
-
三國歷史地圖(Sanguo) : ad0262
-
西晉歷史地圖(W. Jing) : ad0281
-
東晉歷史地圖(E. Jing) : ad0382
-
南北朝歷史地圖(South and North) : ad0497
-
隋代歷史地圖(Sui) : ad0612
-
唐代歷史地圖(Tang) : ad0741
-
北宋歷史地圖(N. Song) : ad1111
-
南宋歷史地圖(S. Song) : ad1208
-
元代歷史地圖(Yuan) : ad1330
-
明代歷史地圖(Ming) : ad1582
-
讀史方輿紀要地名 : ad1582_10_2s
-
清代歷史地圖(Qing) : ad1820
-
西漢歷史地圖(W. Han) : bc0007
-
秦代歷史地圖(Qin) : bc0210
-
明代雲南外邊與軍管政區 : mingbd_yn
-
明代驛站與驛路 : mingtraffic
-
商時期地圖 : shang
-
中華民國新地圖 : spaper
-
春秋時期地圖 : spring_autumn
-
戰國時期地圖 : warring_states
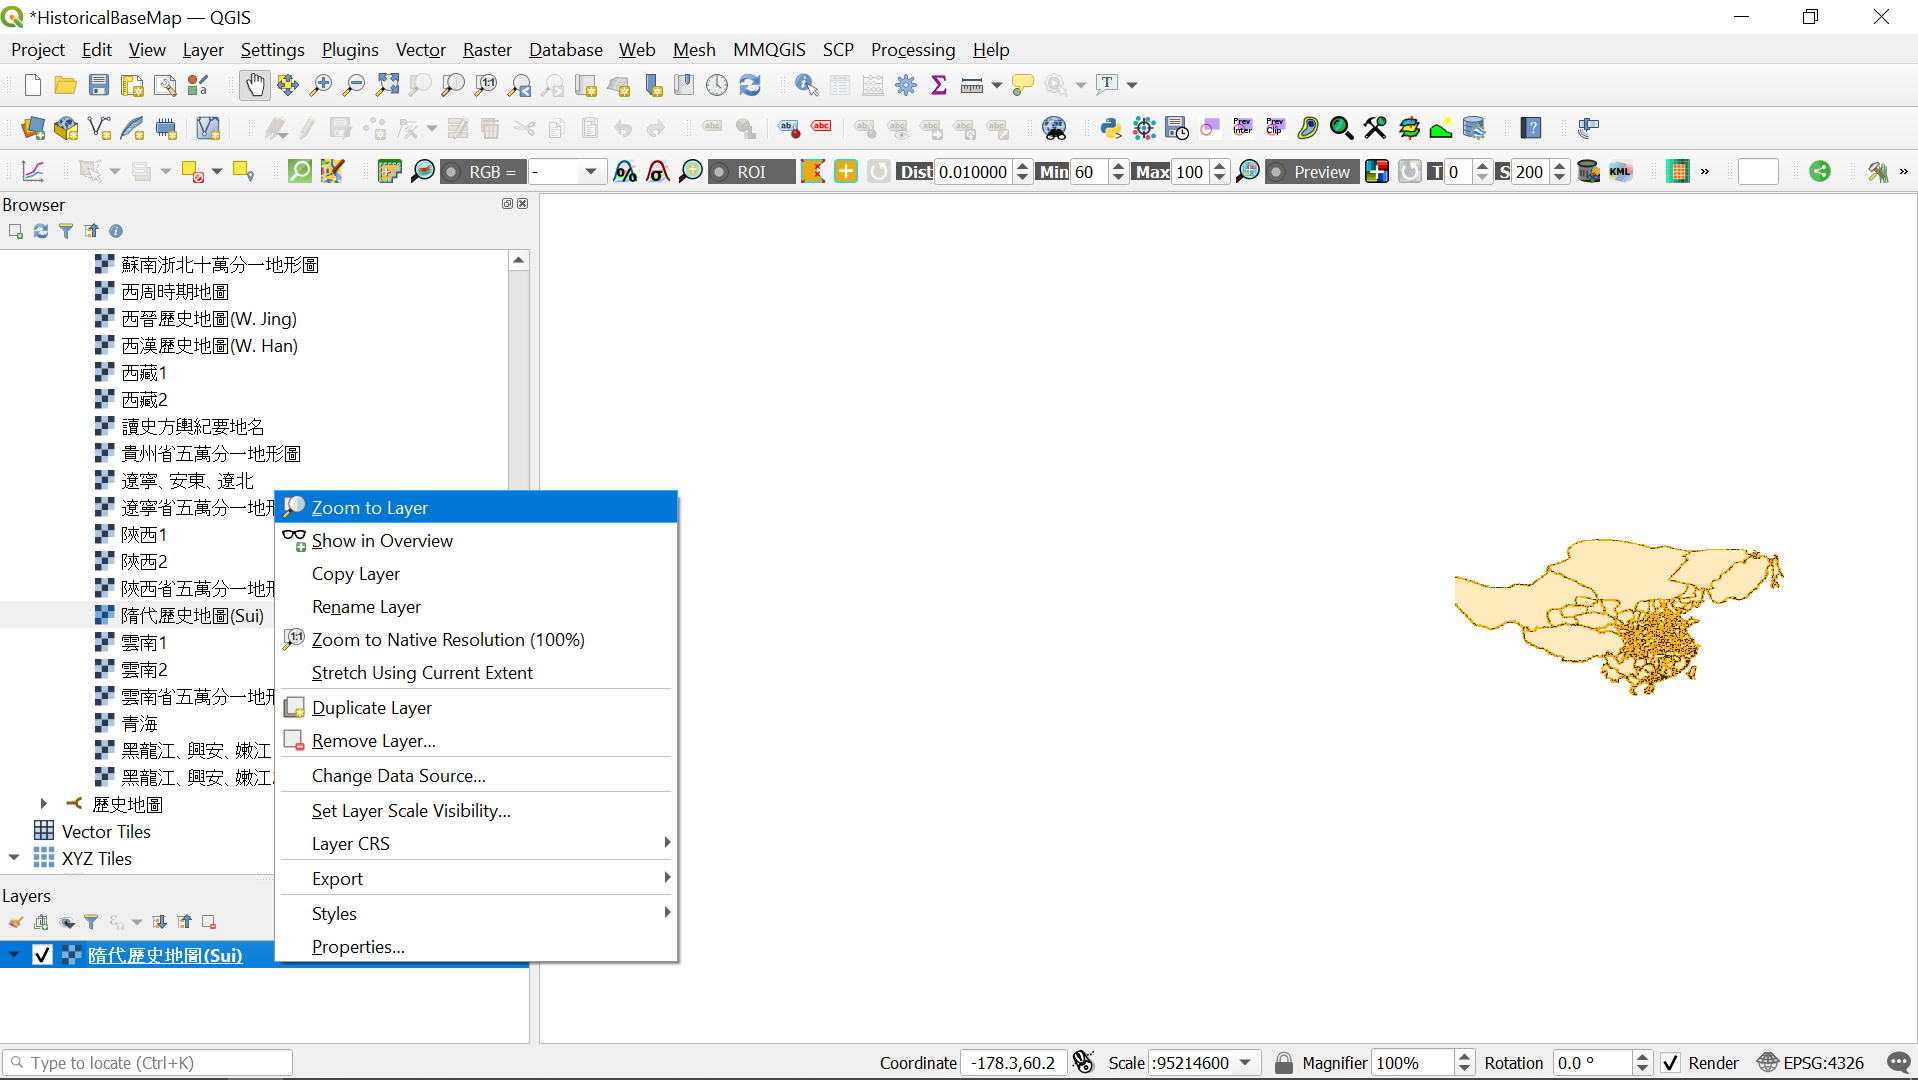
Double click on the layer you like in the browser panel. Now, in the layer panel, you will see a new layer being displayed. To better view the layers, we will right-click the base map layer and select Zoom to Layer

Add Open Street Map
However, the historical base map provided by Academia Sinica do not show fine details for the topography and different provinces. To improve the visuals, I prefer also to add an Open Street Map base map for looking into regional details. To do that, we can use another option for adding a base map: XYZ Tile Layers, which was implemented for tiled services with no plugin required.
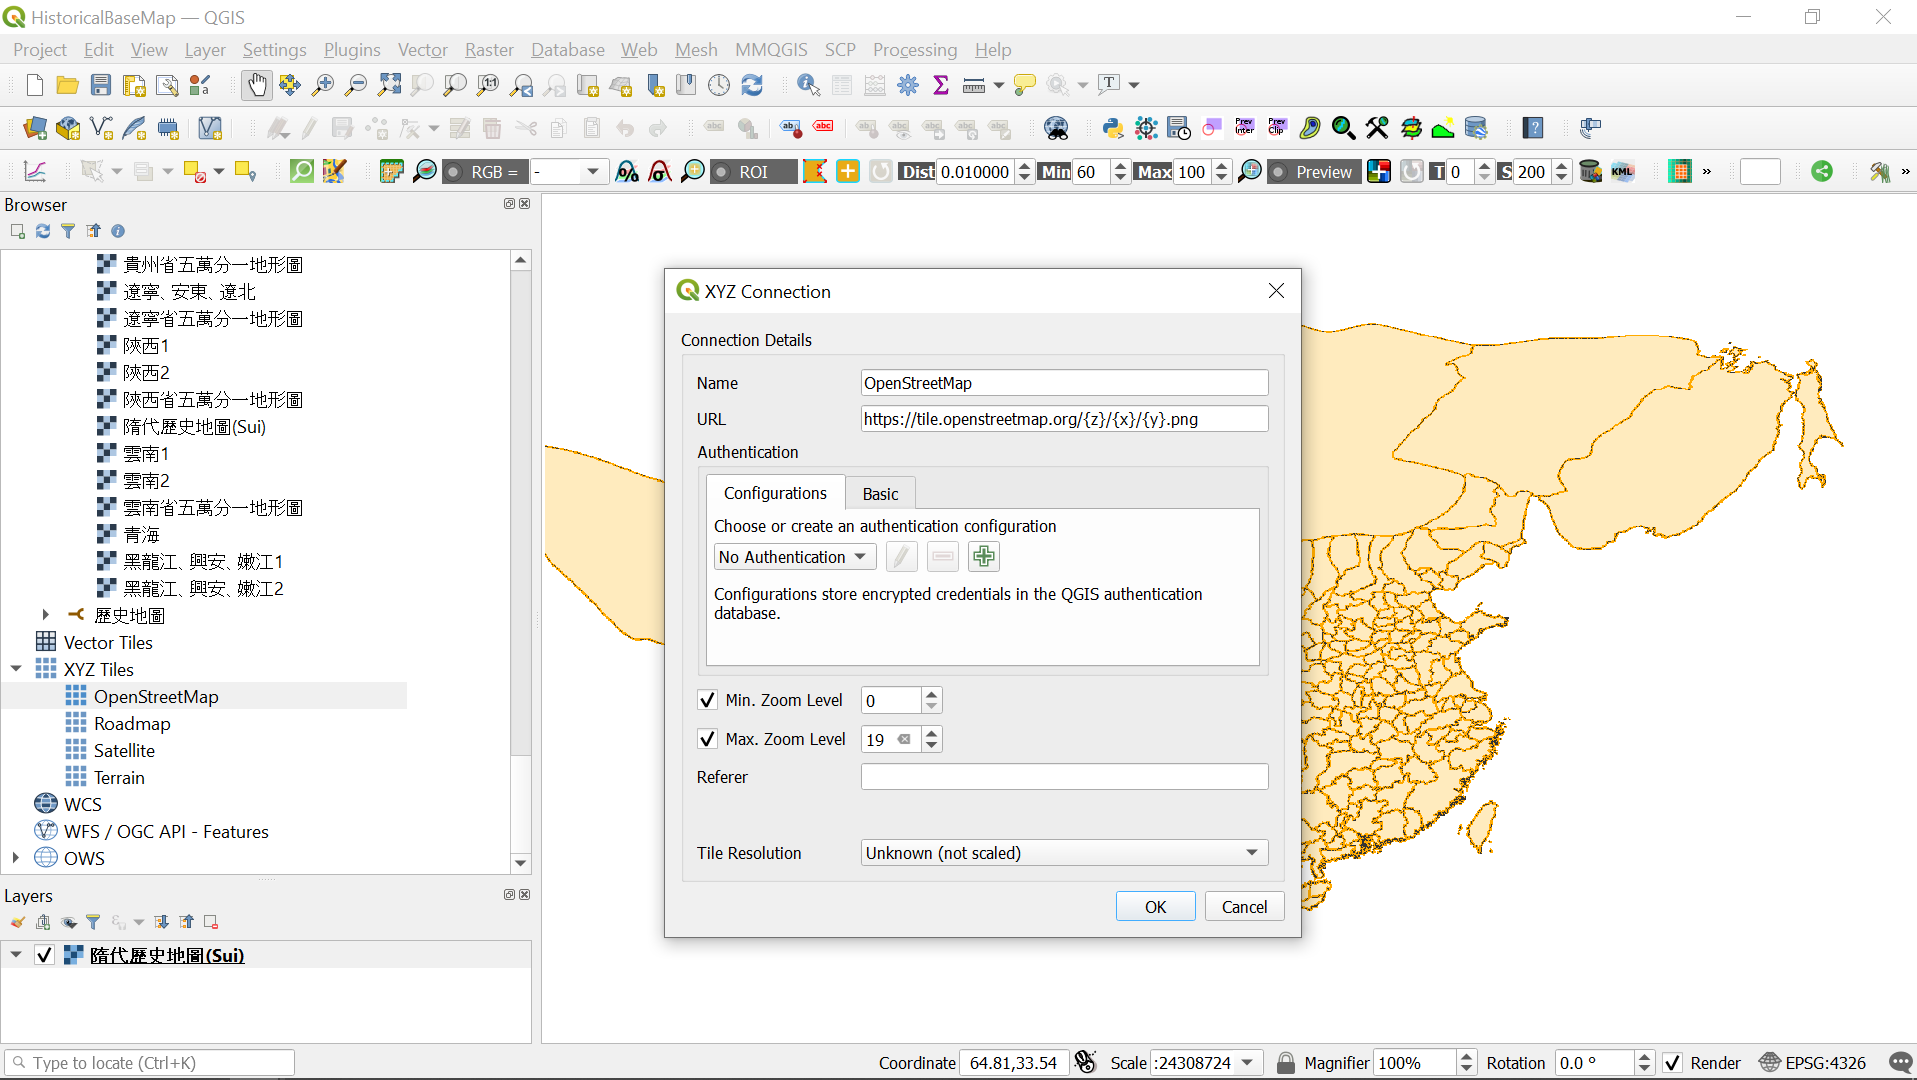
In the Browser Panel (or from the browser panel of the “Data Source Manager”), find the XYZ Tiles and right-click it. Select New Connection. Here we need to provide a name (any name will do) and add the URL. The placeholders {z}, {x}, and {y} will be replaced by QGIS with the appropriate information. To add the Open Street Map (OSM), use the following URL:
https://tile.openstreetmap.org/{z}/{x}/{y}.png

You can also add other options as you like:
Satellite:
http://mt0.google.com/vt/lyrs=s&hl=en&x={x}&y={y}&z={z}
Terrain:
http://mt0.google.com/vt/lyrs=t&hl=en&x={x}&y={y}&z={z}
Pay attention that the layers are displayed in order, so your historical base map will be hidden by OSM if it is put below the OSM layer. Great! Now, we finish with the set-up and can start to play around with our data. Let’s look at our base maps.

References
https://ccts.sinica.edu.tw/framework.php?lang=zh-tw