Hi! This site focuses on Python and aims to support users to conduct academic research in the humanities using open source programming languages. This is created at the end of 2021 by Ka Hei who is a Hongkonger passionated about machine learning and data science.
The establishment of this site aims to improve accessibility of emerging digital Chinese history resources to programming and data science novels who wish to integrate digital tools with historical research. Nonetheless, most of the content and example also fit for all kinds of qualitative humanities data.
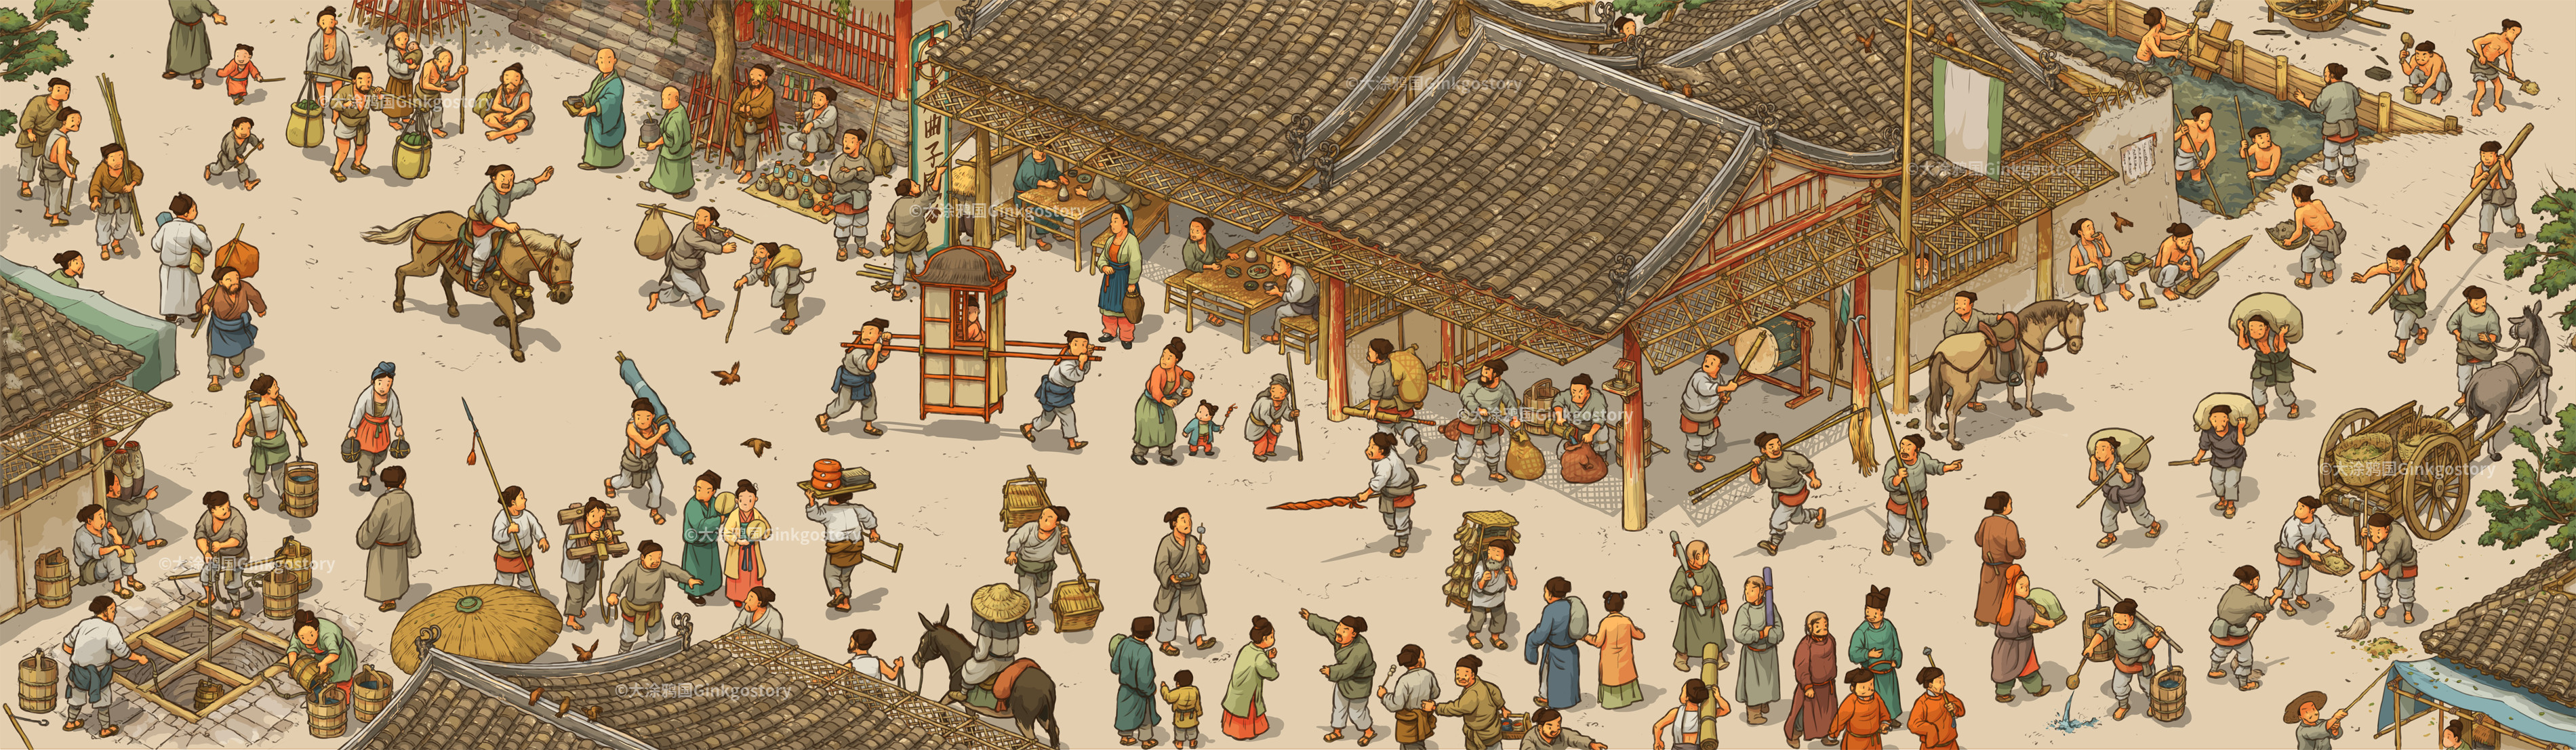
It covers tasks from data acquisition, analysis to visualization, working with both text📜 and geospatial data🗺️. No programming knowledge is required to start with the tutorials. All tutorials use (historical) Chinese text to demonstrate workflows of relevant tasks.
Before start, please read the instructions.
Chapter 1: Python Programming Basics
Are you wondering how to start with Python? The following tutorials prepared you with the basics required for further data analysis and visualization.
Show Lessons
Chapter 2: Data Organization
This chapter covers re and Pandas, the useful libraries for preprocessing and cleaning your data, as well as some simple analysis and plotting using matplotlib.
Show Lessons
Chapter 3: Data Visualization
This chapter covers Bokeh and Plotly, which allow you to create some interactive figures for presentation.
Show Lessons
- Introduction to Data Visualization
- plotly.express: Creating Simple Bubble Chart
- plotly.express: continue with Bubble Timeline
- Colored Stripes
- plotly.express: Gantt Charts and Timelines
- Circular Packing Chart using circlify (Example from 宋朝姓氏分布)
- plotly.graph_objects: Interactive Polar Bar Chart
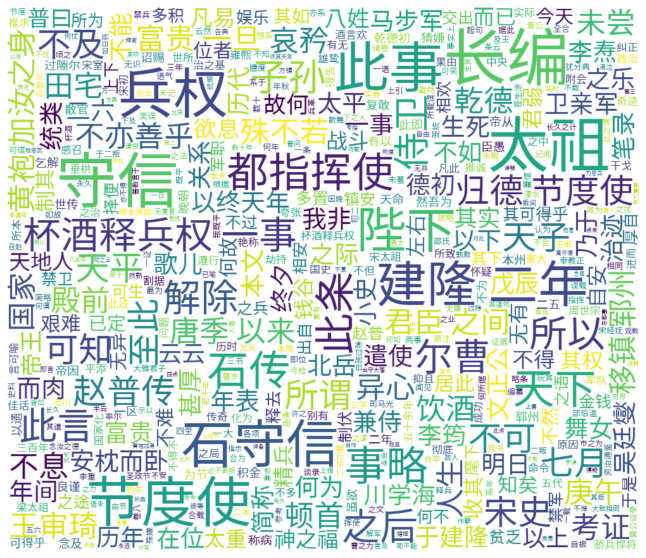
- From PDF to Word Cloud (Example from 杯酒释兵权考)
Chapter 4: Text Analysis
Are you wondering what is NLP and how can you apply them to the digital Chinese texts? Here you will learn some simple concepts and implementations in Python using spaCy, pytesseract, jieba and BeautifulSoup4.
Show Lessons
- Webscrapping using BeautifulSoup4 (Example from 孟浩然诗全集)
- Continue with Webscrapping
- OCR with Chinese Text
- spaCy NLP Introduction
- Continue with NLP
- TF-IDF
- Textual Similarity
- Sentiment Analysis
Chapter 5: Network Analysis
Here some basic concepts for network analysis are covered using NetworkX, PyVis and Plotly.
Show Lessons
- NetworkX Introduction (Example from 中国历代进士资料库)
- Plotly with NetworkX
- PyVis
Chapter 6: Geospatial Map
In chapter 6, we begin to work with spatial data which is essential for creating map. Apart from GIS, geospatial analysis and visualization can also be performed in Python. Libraries geopandas and folium are covered.
Show Lessons
- Geocoding Chinese Place Names
- Introduction to Vectors
- Introduction to Geopandas: Analysing Geometry Objects
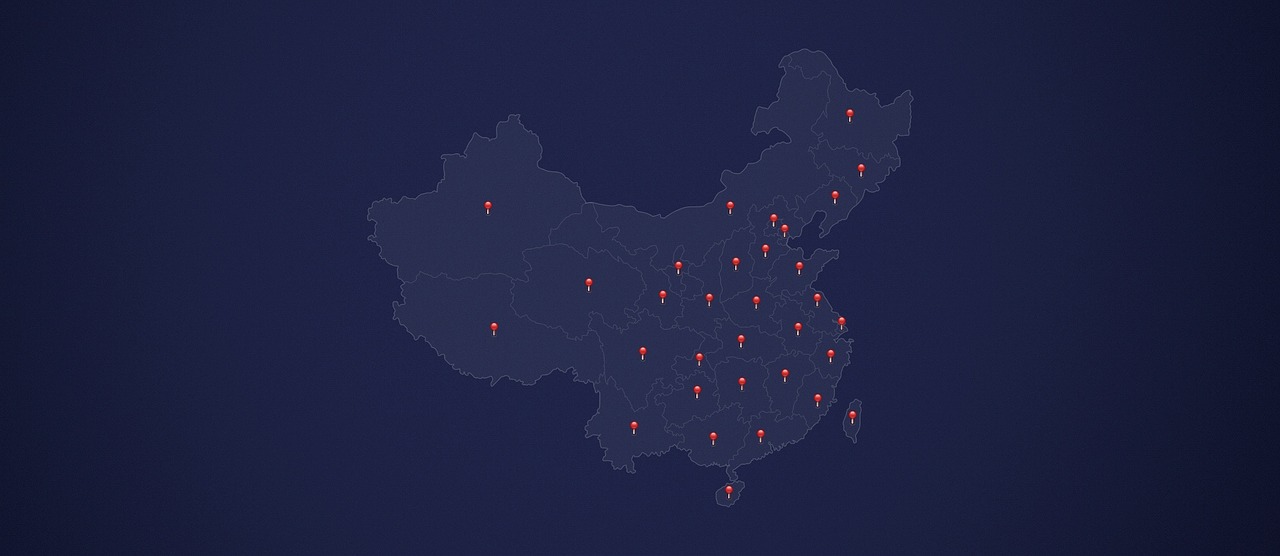
- Introduction to Folium: Starting with Maps (Example from CHGIS)
- Choropleth Map (Example from CHGIS)
Chapter 7: Web-based Tools
In order to share your interactive presentation, a web application can be useful. Here Github Pages and dash is covered to show the workflow for creating a simple webmap.
Show Lessons
- GitHub pages
- Hosting Webmaps
Chapter 8: Machine Learning
Machine learning has become a popular topic also for text analysis. Here some simple concepts are discussed, for example, its applications on topic modelling and text document clustering.
Show Lessons
(Coming soon ...)
If you like my content, feel free to follow and endorse me on Twitter and GitHub.
Posts


- •
- 1
- 2