Python for Research Q & A 🖋️
What is Python all for?


- Background
- General-purpose Language
- For Qualitative Research
- What can Python do for me?
- Geospatial Data ??
- Interactive Bubble Chart ??
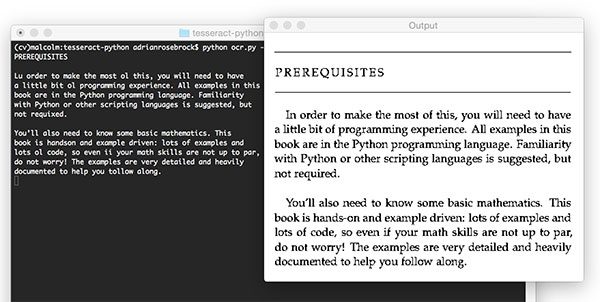
- Text Optical Recognition (OCR) ??
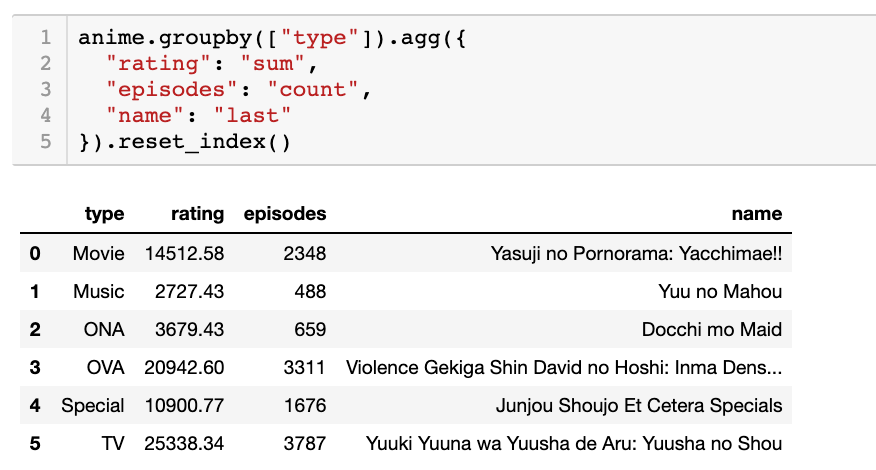
- Data Cleaning ?? Manipulation ??
- Data Mining ?? Web Scraping ??
- Web Application ?? App ??
- Additional information
- References:
As mentioned in the instructions, all materials can be open in Colab as Jupyter notebooks. In this way users can run the code in the cloud. It is highly recommanded to follow the tutorials in the right order.
Background
Python is getting more and more popular, not only in the field of computer science, but also in the diverse fields when it comes to computation, working with digital resources and data presentation. This notebook aims to give users some basic knowledge about the potential of Python programming language in the context of humanity research.
Presumption: Not applicable
Although Python is a programming language, it is different from other low-level programming languages by being more user-friendly and more close to a interpreter than machine code. It is for general purpose and also relatively beginner-friendly.
Python is not only more readable, it also has less structural rules and usually much shorter. Compared to other languages such as JavaScript, Python has not so much low-level language like syntax so its learning curve is not as steep.
General-purpose Language
Although you might have read other tutorials telling you how you can use very diverse tools to achieve fancy tasks that you wish to perform. You also have to realize that how much time will you need to master that languages or tools before tasks can be done.
Let's assume that you are not a real web developer here and data analysis or visualization is not your primary profession. It means, you are not making your living by making charts and websites, and for you making creative and fancy new charts is not as important as making a not so time-consuming and presentable bar chart which display your results to the audience or in your paper.
Most often, what you need is then much more simple functionalities which a fancy tool can overkill. You also need to consider that not all digital tools are open and free, so using multiple of them can cost you time and money.
For Qualitative Research
Although Python is a programming language and is often associated with computing and numbers, it can help you with qualitative research too! It includes many functionalities to work with text resources. Although you do not need to do calculation on them, sometimes you do want to find a pattern in them, look for the keywords, or just get them into digital text.
Data Input
Python can help you to get your qualitative sources. Let's say you want to look into BDK (Bukkyo Dendo Kyokai) Database for the A Biography of Sakyamuni. And you want to get the text file of certain chapters. What you can do is to use Python to scrap the text and load it in a file for you. Or let's say you want to have all the Buddhist texts having a particular keywords, then you can filter the text using Python.
Data Analysis
So now you got the text. But you want to see how does certain keywords distributed inside your text(s), or what is the associated sentiment of the text(s). Then you can perform NLP in Python. Or if you have a database of Buddhist temples and want to analysis what regions are they mostly located in, then you can perform some geospatial analysis in Python too.
Data Presentation
Let's say now you got your results already, and you need to present them either in a paper, in a PowerPoint or make a simple webpage that you can shared with your colleagues or your audience. You can also make both static and interactive charts/ text visualization using Python. They can be either a bar chart for comparison, a word cloud for showing key words, or a map showing geolocations of objects.
Checking out some galleries:
What can Python do for me?
Python can indeed handle a large variety of tasks, from get data for you (web scraping), to analysis your data (text analysis), to present your results (data visualization). Its high speed allow you to scan and work with a large amount of data and search for the ones that you are interested in! You can then either analyse them with Python or continue by yourself to read the information retrieved. Or Python simply let you present what you have in mind, like a time line, in a digital format.
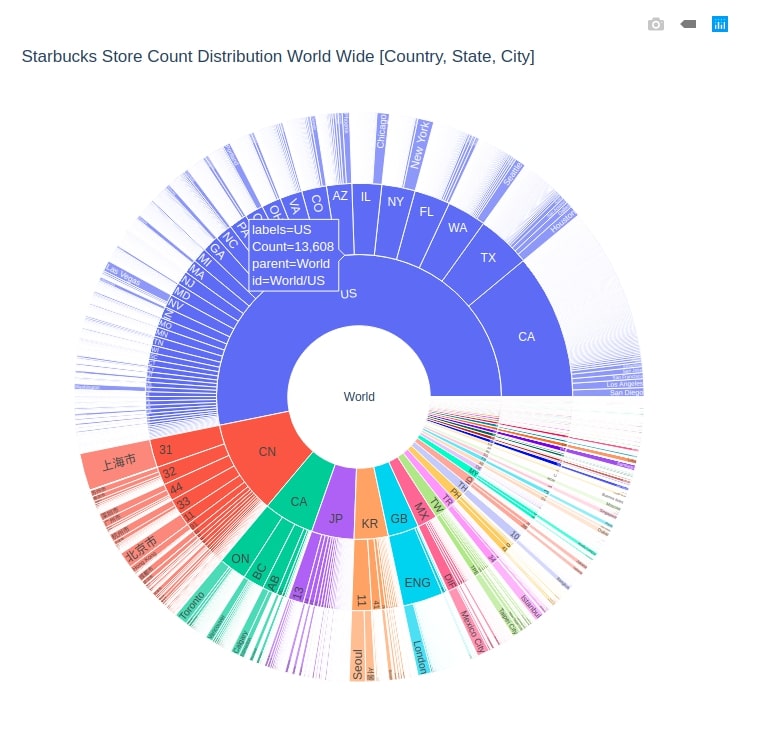
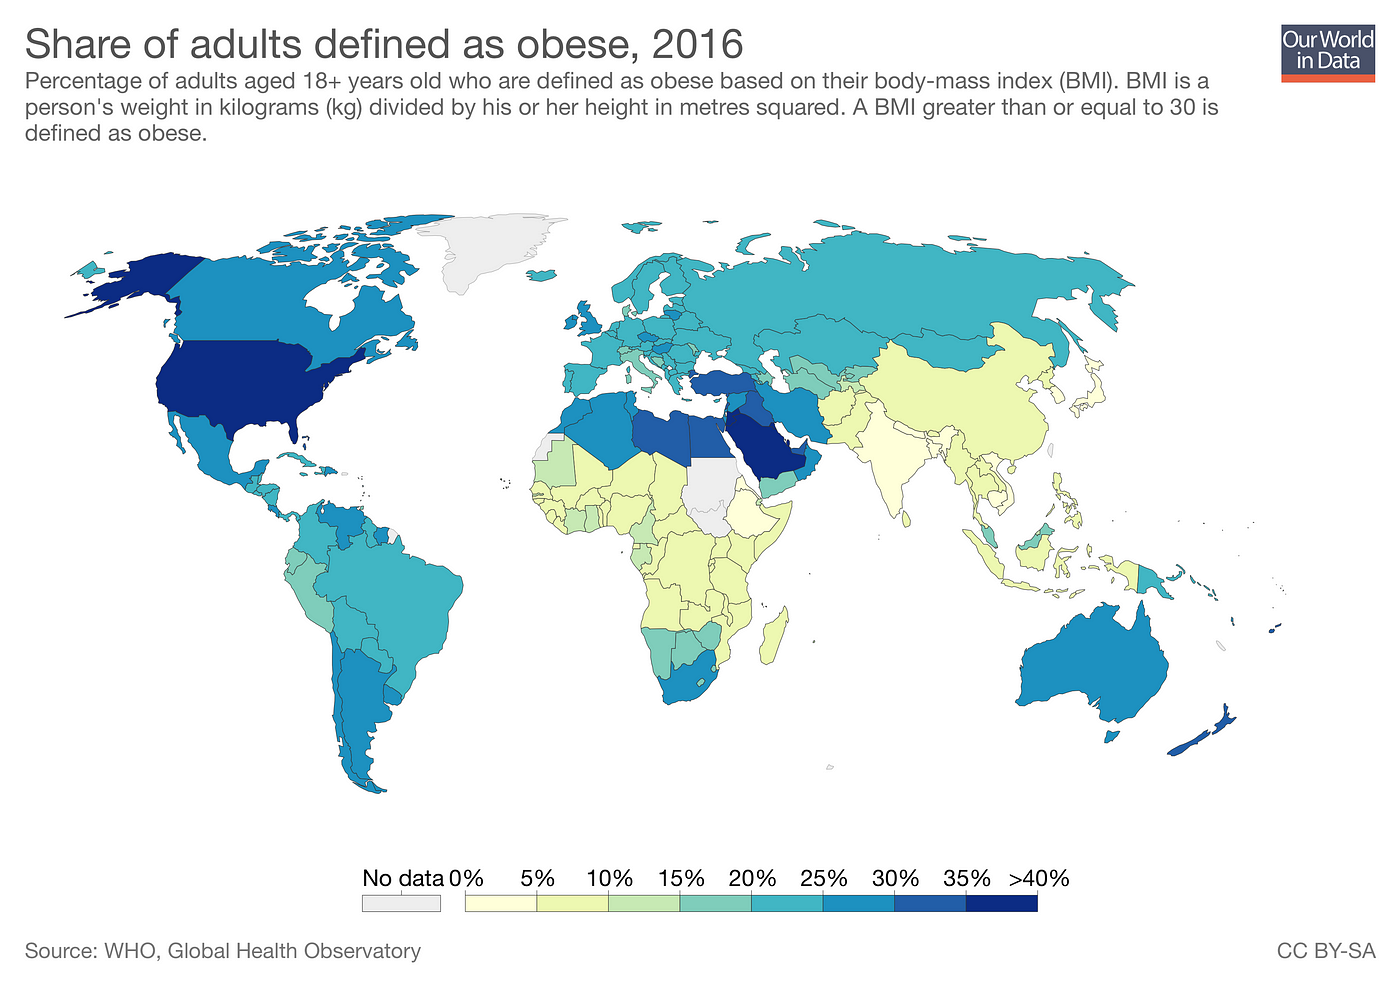
For example, you might have read about Mapbox.js, Leaflet.js, R or GIS for analysing geospatial data, making choropleths and interactive graphics. But Python can do it too using Plotly, Folium and Geoopandas!


Next Lesson: Introduction to Jupyter & Colab
Additional information
This notebook is provided for educational purpose and feel free to report any issue on GitHub.
Author: Ka Hei, Chow
License: The code in this notebook is licensed under the Creative Commons by Attribution 4.0 license.
Last modified: December 2021